MRED Blog
REinventing MLS
Category Archives: Statistics
MRED Chicagoland Report for September, 2015
The third quarter of 2015 has ticked its last tock with the hands pointing firmly upon a reliable clock of a market. Although noon and 6:30 fluctuations are present even within the same states and cities, the overall tempo of real estate potential is experiencing a healthy number of good omens. The job market has shown continual improvement, jobless rates are down, real average hourly and weekly earnings have been up and there has been good news in new household formation.
New Listings in Chicagoland were up 0.1 percent for detached homes but decreased 4.9 percent for attached properties. Listings Under Contract increased 19.5 percent for detached homes and 9.6 percent for attached properties.
The Median Sales Price was up 5.0 percent to $210,000 for detached homes and 6.1 percent to $175,000 for attached properties. Months Supply of Inventory decreased 19.1 percent for detached units and 17.8 percent for attached units.
With positive economic news coming from many angles, there are no imminent factors to prepare for beyond the typical seasonal drop-off. From the mouths of market-analyzing pundits, we are in the midst of one of the healthiest housing markets in the past 15 years. The one thing we were anticipating in September, an increase in interest rates, did not happen. It most likely will before year’s end. Until then, get out and enjoy the season.
MRED real estate professionals can log into MREDLLC.com and click on the Statistics tab to get the latest Lender Mediated and Monthly Market Indicators Reports. You can also click on the Local Market Updates choice under the Statistics tab and use our Interactive Market Analytics map for the latest local market metrics.
Any questions? Please contact MRED’s Help Desk at 630-955-2755 or help.desk@MREDLLC.com.
3 Graphs That Scream List Your House Today!

In school we all learned the Theory of Supply and Demand. When the demand for an item is greater than the supply of that item, the price will surely rise.
SUPPLY
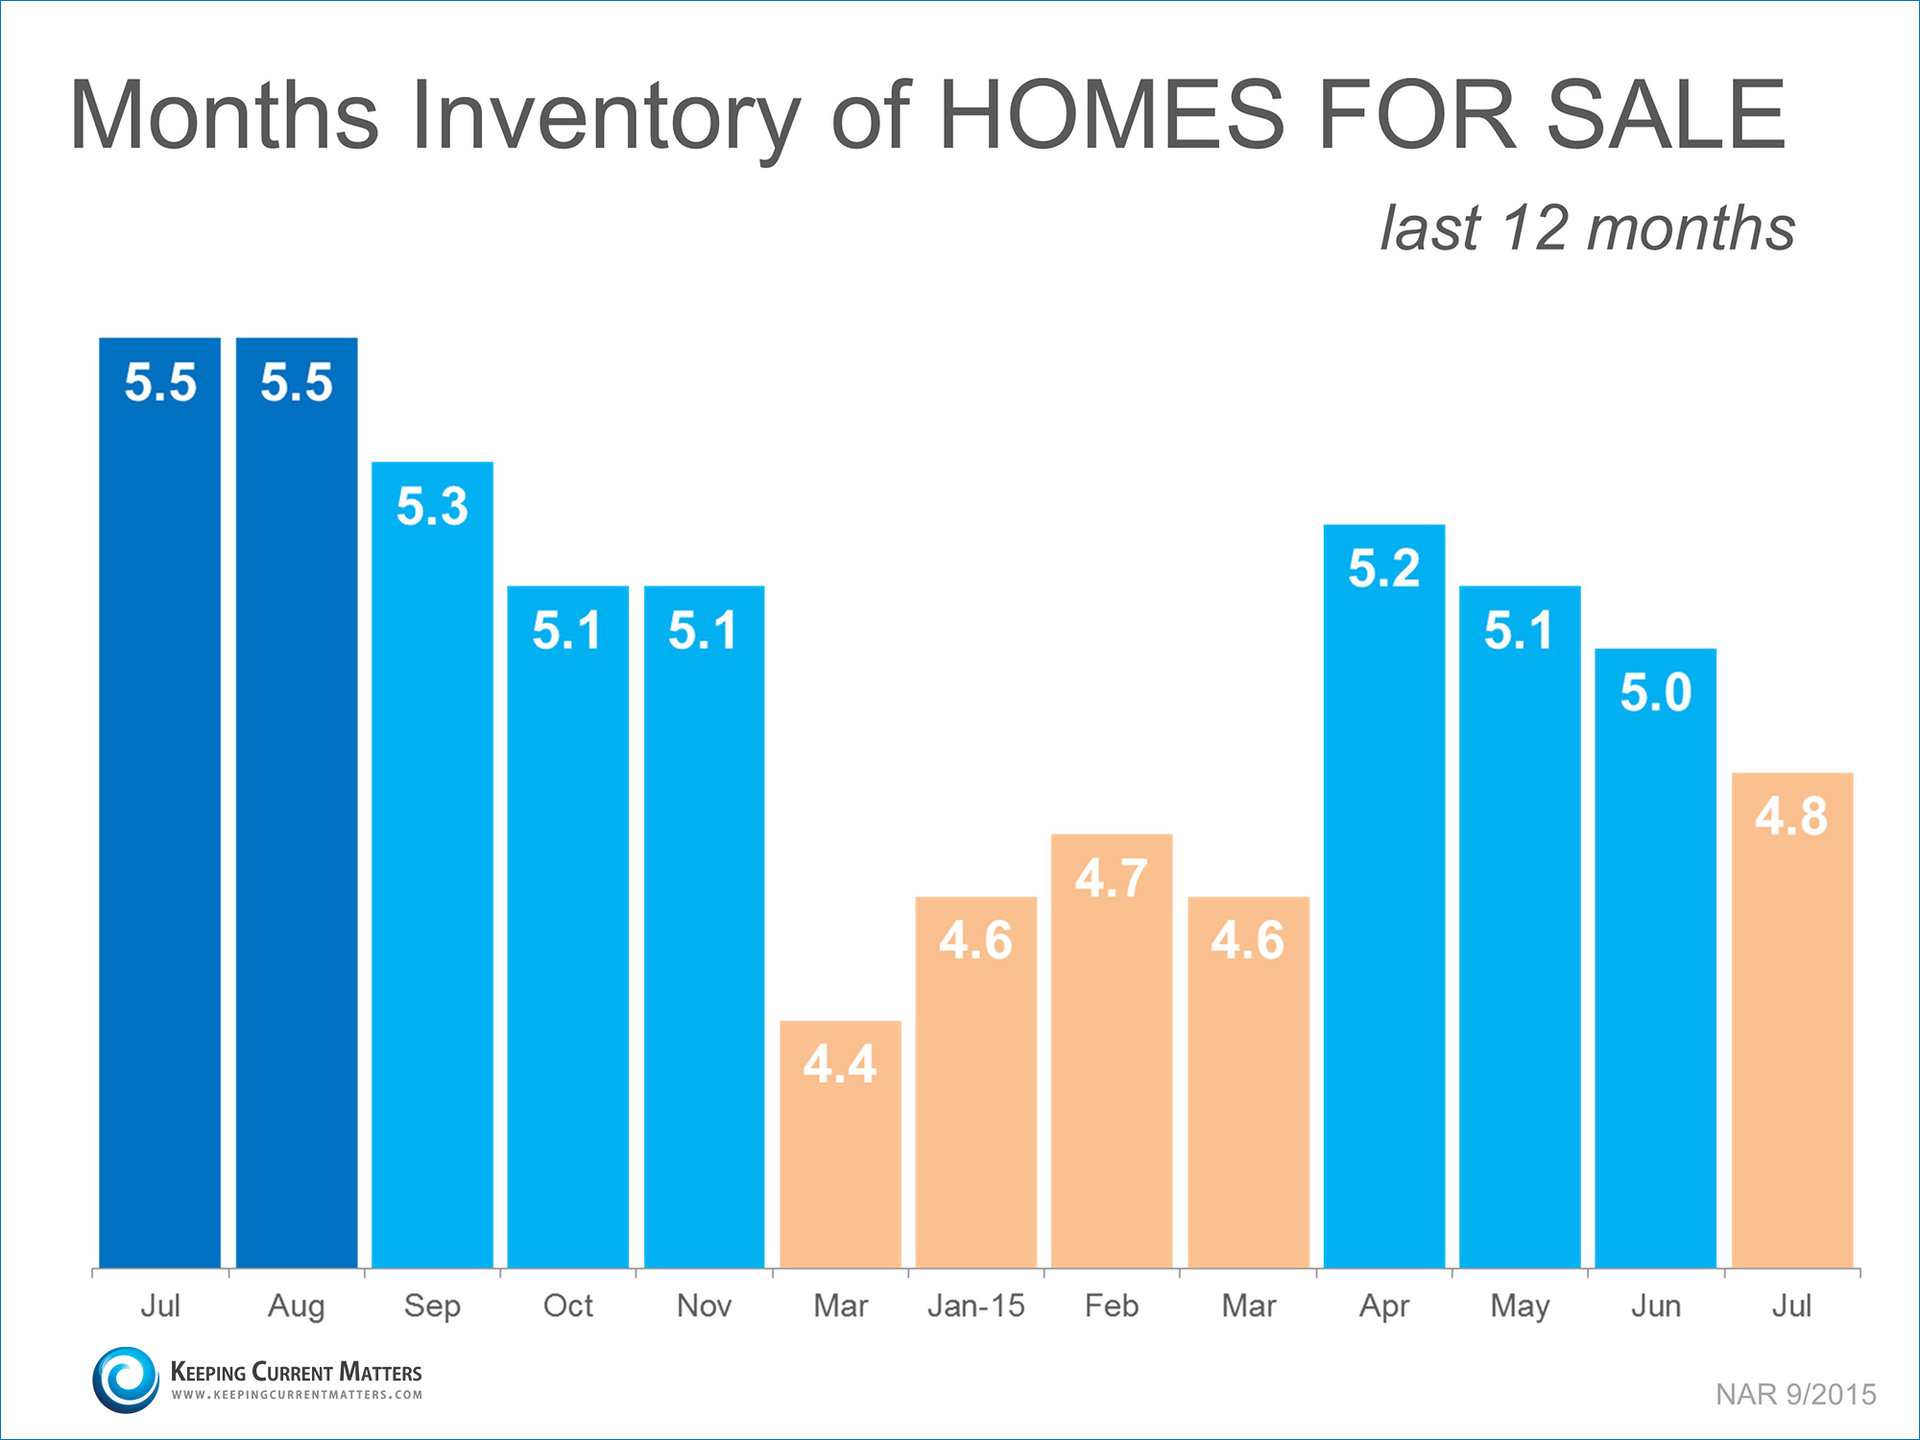
The National Association of Realtors (NAR) recently reported that the inventory of homes for sale stands at a 4.8-month supply. This is significantly lower than the 6 months inventory necessary for a normal market.
DEMAND
Every month NAR reports on the amount of buyers that are actually out in the market looking for homes, or foot traffic. As seen in the graph below, buyer demand this year has significantly surpassed the levels reached in 2014.
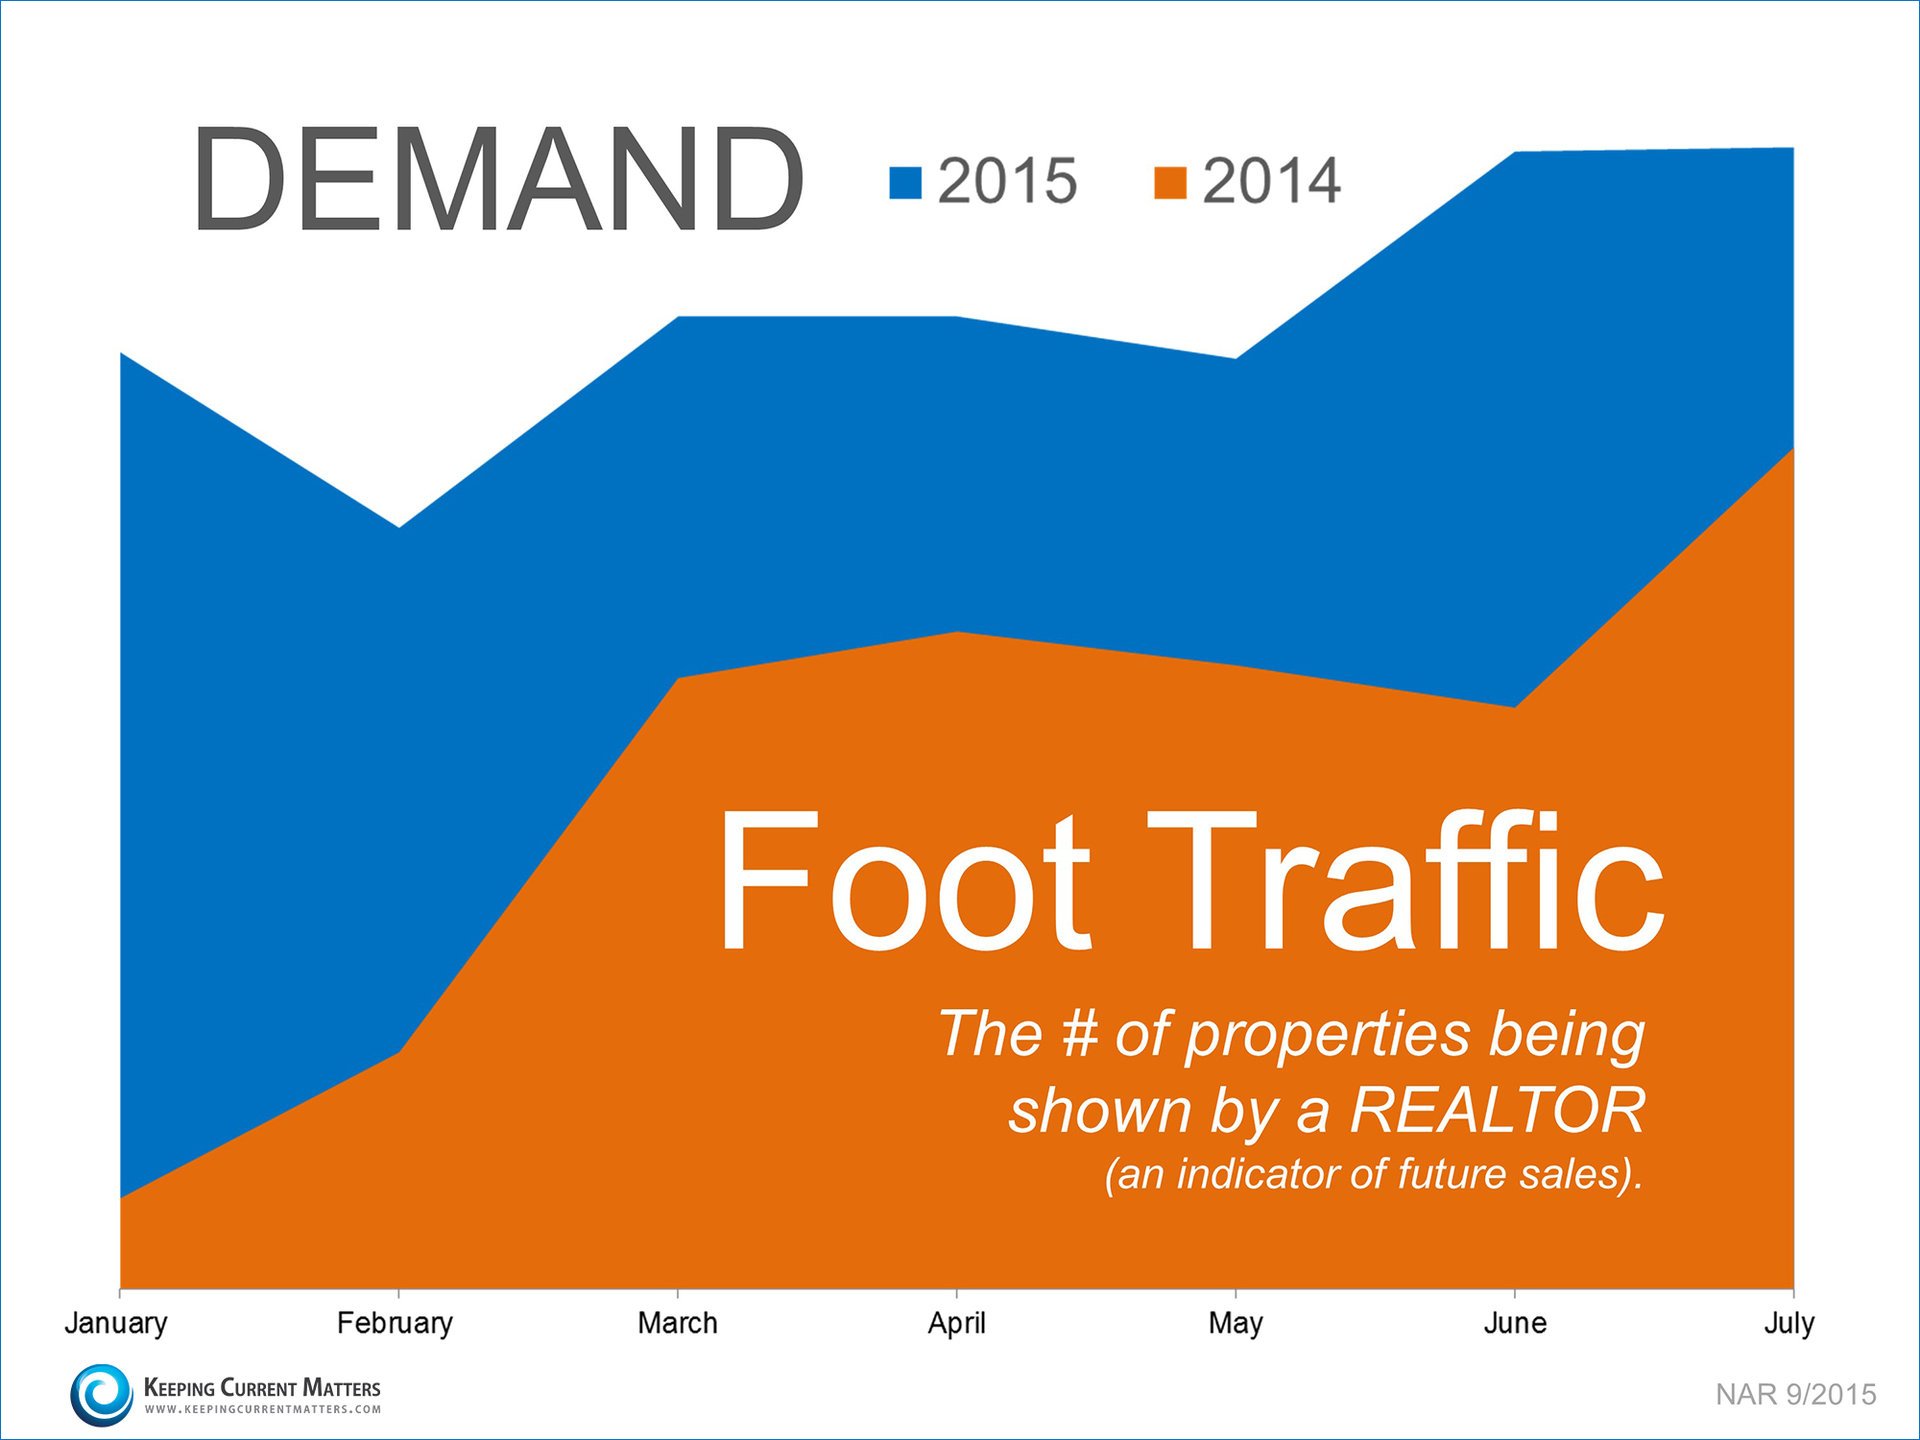
Many buyers are being confronted with a very competitive market in which they must compete with other buyers for their dream home (if they even are able to find a home they wish to purchase).
Listing your house for sale now will allow you to capitalize on the shortage of homes for sale in the market, which will translate into a better pricing situation.
HOME EQUITY
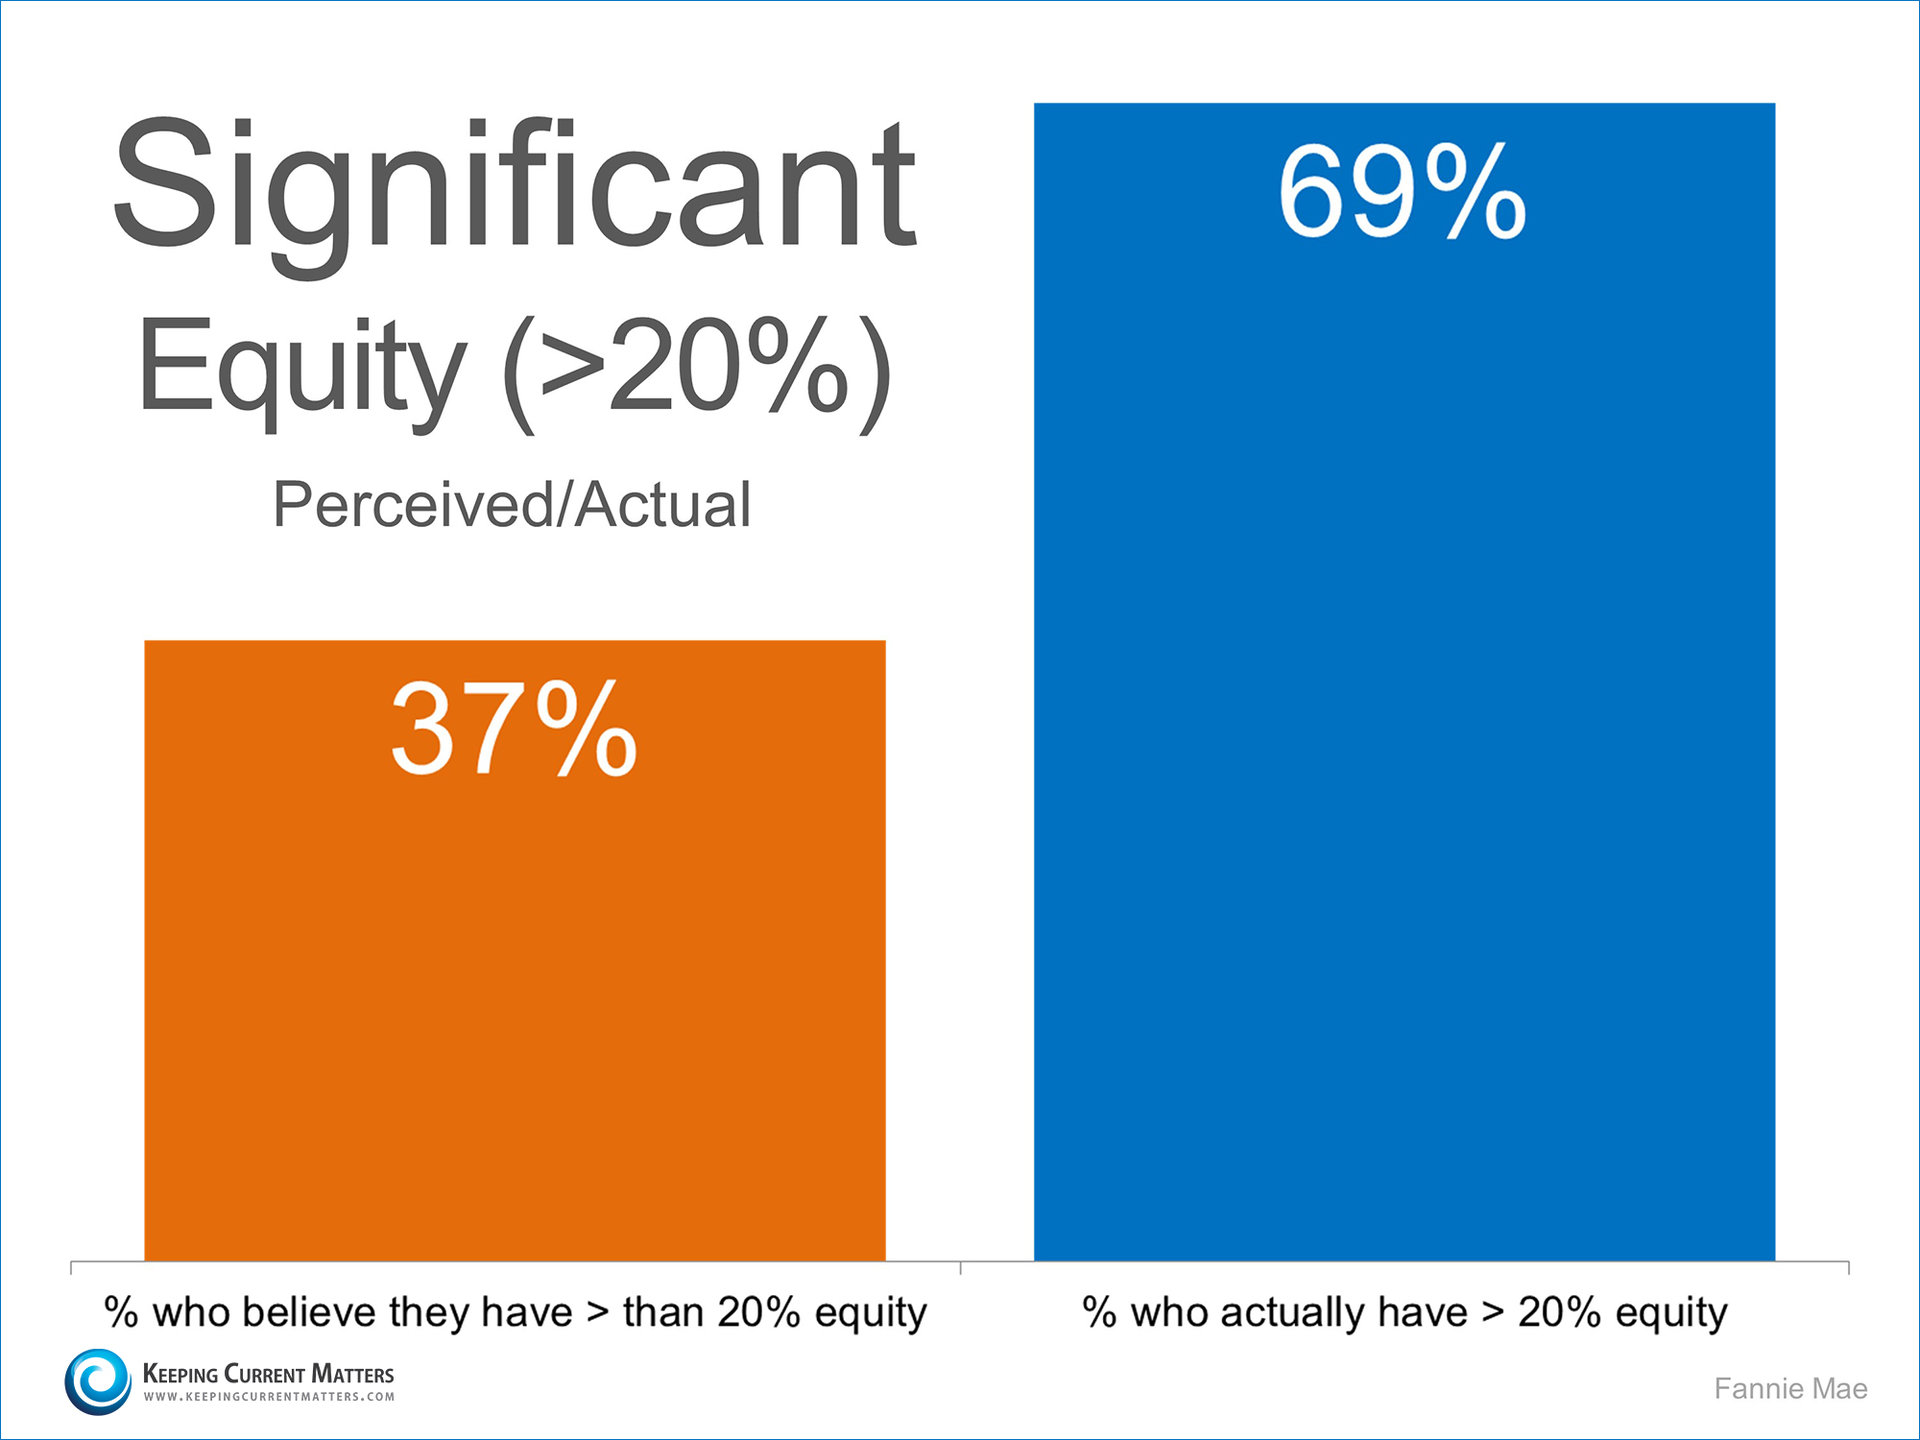
Many homeowners underestimate the amount of equity they currently have in their home. According to a recent Fannie Mae study, 37% of homeowners believe that they have more than 20% equity in their home. In reality 69% of homeowners actually do!
Many homeowners who are undervaluing their home equity may feel trapped in their current home, which may be contributing to the lack of inventory in the market.
Bottom Line
If you are debating selling your home this year, meet with a local real estate professional that can evaluate the equity you have in your home and the opportunities available in your market.
Blog Post via KCM Blog
MRED Chicagoland Report for August, 2015
Home prices were up during summer across the nation in year-over-year comparisons. With the economy on full mend, Federal Reserve Chair Janet Yellen has predicted a fine-tuning of monetary policy before the year ends. In tandem with the improved economy, the unemployment rate for August 2015 remained at 5.3 percent for the second month in a row. It is widely believed that interest rates will go up before the year is over. Generally, this does not happen without careful consideration for the impact such a move will have on residential real estate.
New Listings in Chicagoland were up 2.4 percent for detached homes and 3.4 percent for attached properties. Listings Under Contract increased 23.4 percent for detached homes and 17.4 percent for attached properties.
The Median Sales Price was up 2.3 percent to $221,900 for detached homes and 4.5 percent to $185,000 for attached properties. Months Supply of Inventory decreased 17.6 percent for detached units and 18.2 percent for attached units.
Statistics released by the U.S. Census Bureau and the Department of Housing and Urban Development indicate that privately-owned housing starts in August 2015 rose 10.1 percent compared to last year to the highest level the market has seen since October 2007. This bodes well for the eventual landing of a flock of potential buyers currently holding in a rental pattern. As ideal summer weather diverges toward autumn, we will begin to see some seasonal relaxation, but the market should still look positive when compared to last year.
MRED real estate professionals can log into MREDLLC.com and click on the Statistics tab to get the latest Lender Mediated and Monthly Market Indicators Reports. You can also click on the Local Market Updates choice under the Statistics tab and use our Interactive Market Analytics map for the latest local market metrics.
Any questions? Please contact MRED’s Help Desk at 630-955-2755 or help.desk@MREDLLC.com.
The Cost of Waiting to Buy a Home

The National Association of Realtors (NAR) recently released their July edition of the Housing Affordability Index. The index measures whether or not a typical family earns enough income to qualify for a mortgage loan on a typical home at the national level based on the most recent price and income data.
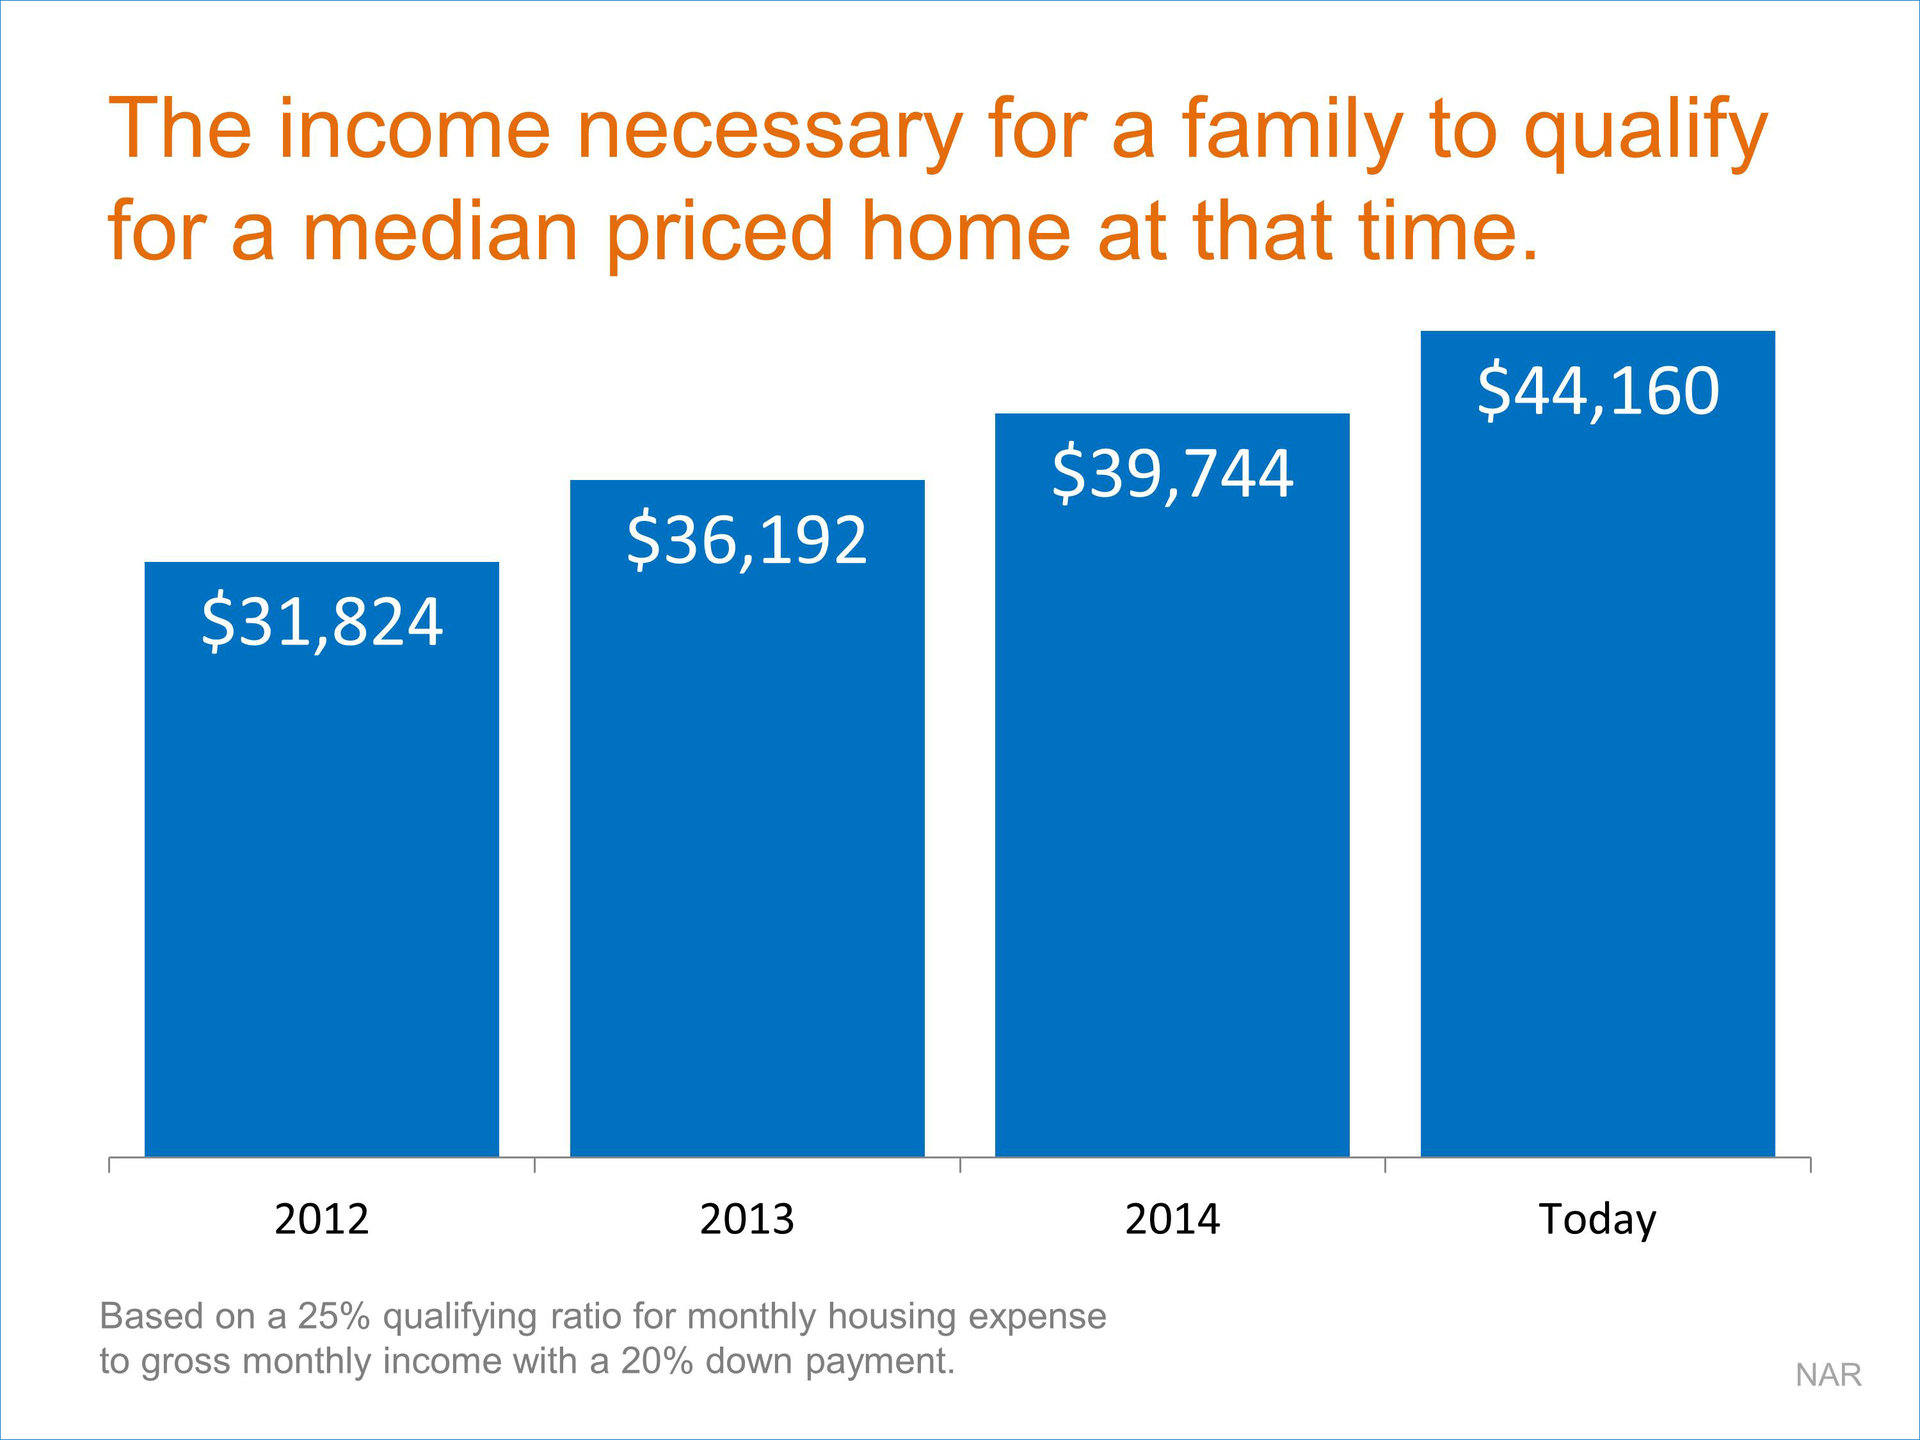
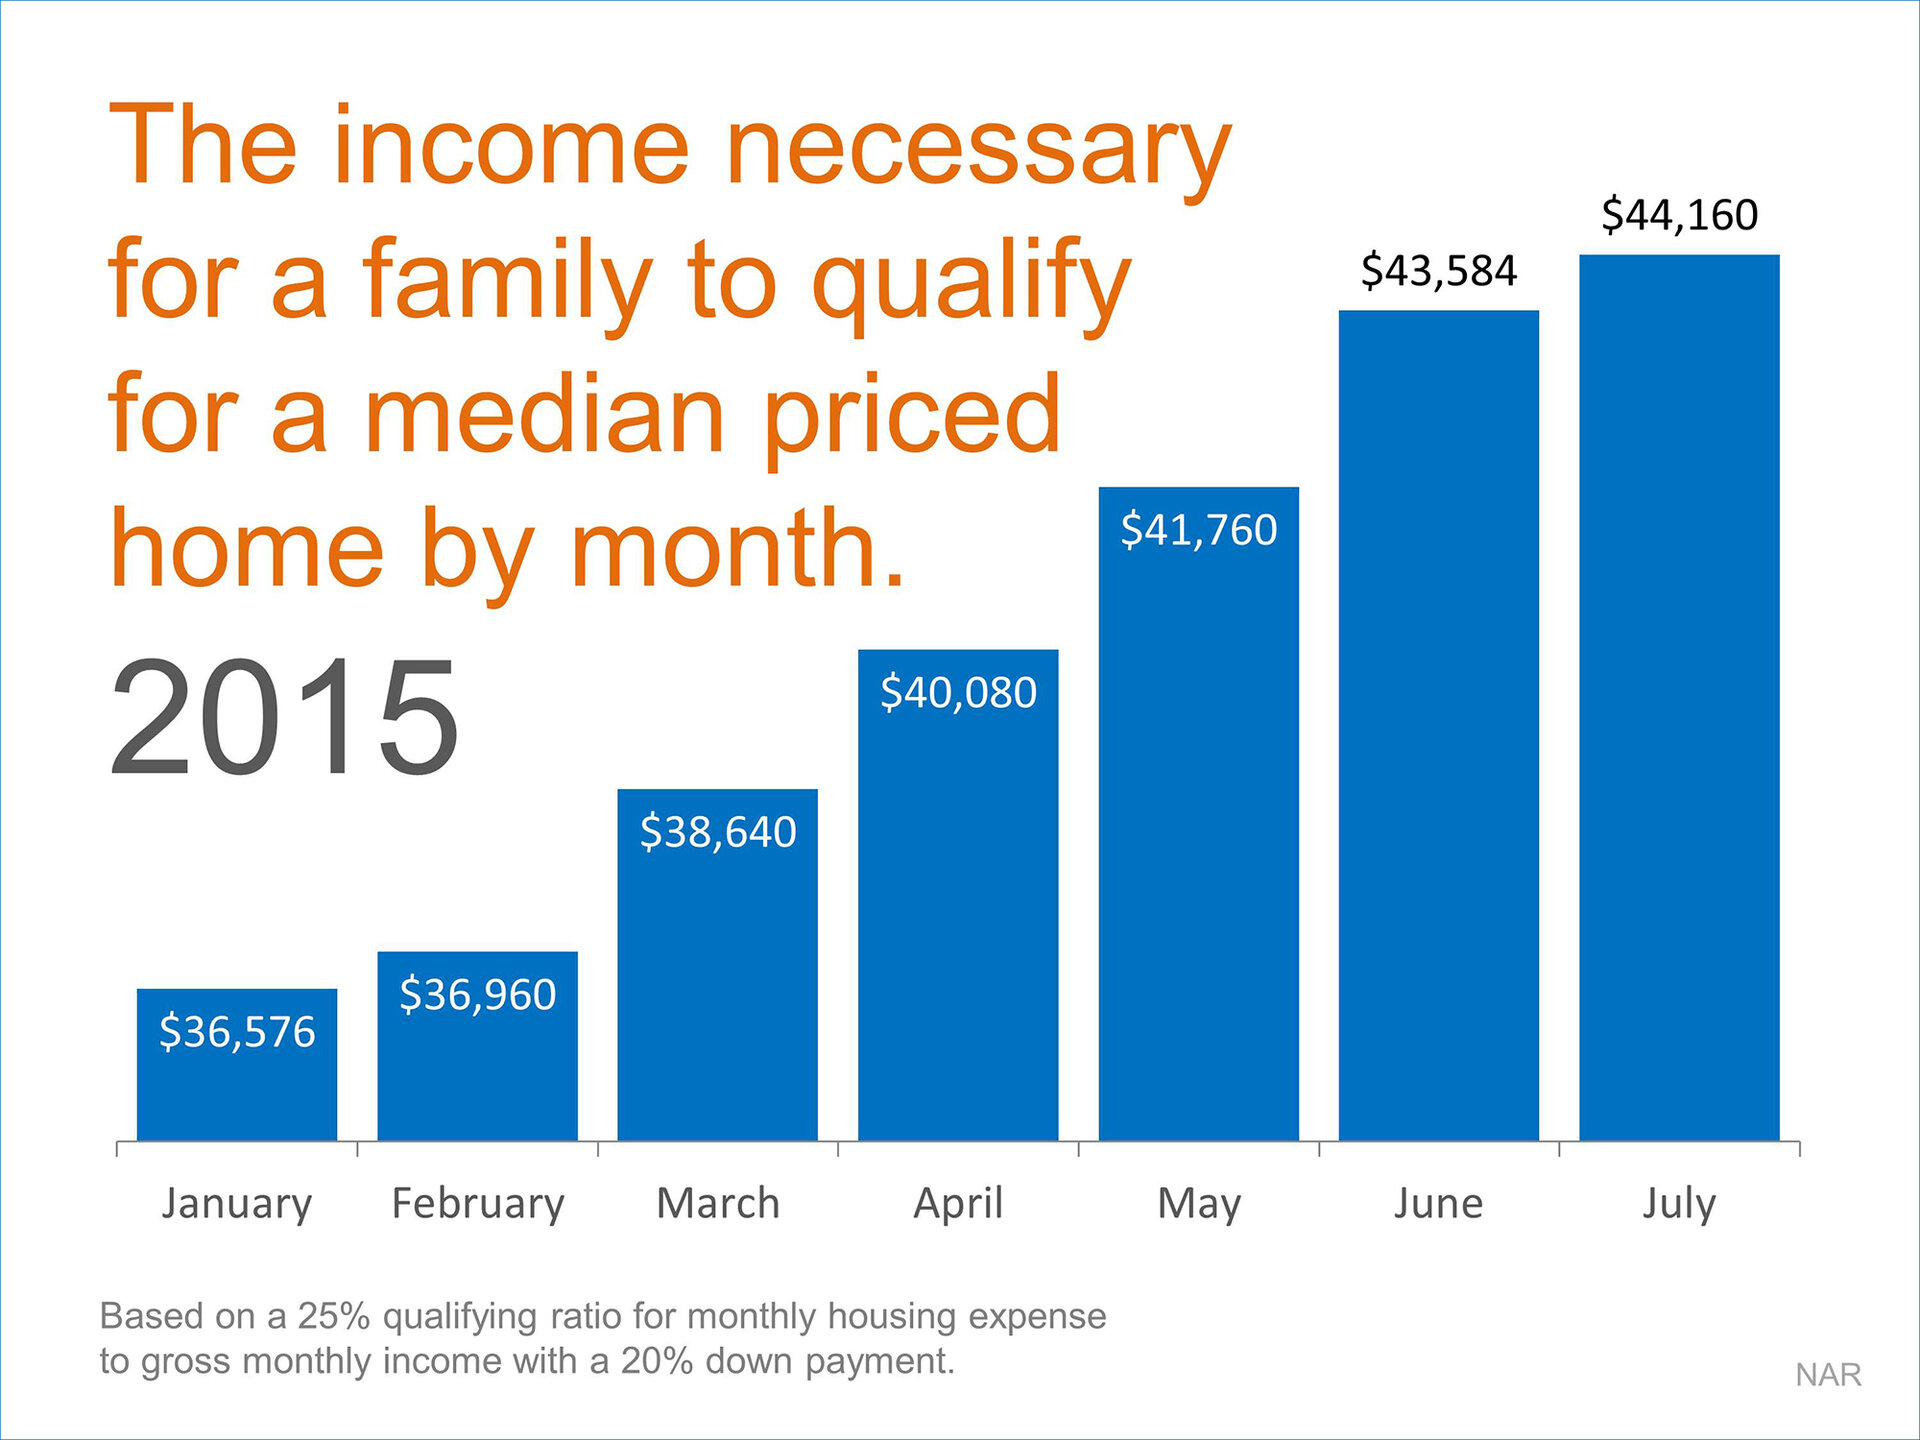
NAR looks at the monthly mortgage payment (principal & interest) which is determined by the median sales price and mortgage interest rate at the time. With that information, NAR calculates the income necessary for a family to qualify for that mortgage amount (based on a 25% qualifying ratio for monthly housing expense to gross monthly income and a 20% down payment).
Here is a graph of the income needed to buy a median priced home in the country over the last several years:
And the income requirement has accelerated even more dramatically this year as prices have risen:
Bottom Line
Some buyers may be waiting to save up a larger down payment. Others may be waiting for a promotion and more money. Just realize that, while you are waiting, the requirements are also changing.
Blog Post via KCM Blog
MRED Chicagoland Report for July, 2015
According to the U.S. Census, homeownership is at 63.4 percent for the second quarter of 2015, down 1.3 percent from the second quarter of 2014. This is the lowest rate of homeownership since 1967. To put that in greater context, homeownership peaked at 69.2 percent in 2004, and the 50-year average is 65.3 percent. Although the data may be indicating otherwise on a macro level, mortgage applications have kept REALTORS® busy through summer.
New Listings in Chicagoland were up 4.7 percent for detached homes and 1.3 percent for attached properties. Listings Under Contract increased 20.1 percent for detached homes and 22.5 percent for attached properties.
The Median Sales Price was up 3.1 percent to $230,000 for detached homes and 6.1 percent to $189,950 for attached properties. Months Supply of Inventory decreased 14.8 percent for detached units and 16.2 percent for attached units.
Ever since the Great Recession ended in about June 2009, the market has strengthened to once again become a cornerstone of the national economy. Better lending standards, lower oil prices and higher wages are a few of the catalysts for positive change. Many trends continue to reveal a stable housing market. Federal Reserve Chair, Janet Yellen, has predicted a fine-tuning of monetary policy by the end of the year. It is widely believed that interest rates will go up before the year is over, an indicator that the housing market is ready for such a move.
MRED real estate professionals can log into MREDLLC.com and click on the Statistics tab to get the latest Lender Mediated and Monthly Market Indicators Reports. You can also click on the Local Market Updates choice under the Statistics tab and use our Interactive Market Analytics map for the latest local market metrics.
Any questions? Please contact MRED’s Help Desk at 630-955-2755 or help.desk@MREDLLC.com.
Pending home sales index falls for first time in months, performs unequally across regions
Although pending homes (contracts signed) increased for the last five months, in June, they fell slightly (1.8 percent), remaining near May’s level. The Pending Home Sales Index (PHSI) is an indicator put out by the National Association of Realtors (NAR) who is quick to point out that May’s level was the highest in over nine years, so it is our assessment that there is no need to panic or get cynical about the market.
Further, the West and Northeast actually saw gains for the month, but were offset by larger declines in the Midwest and South. The PHSI is now 8.2 percent above a year ago, also making June the third highest reading of 2015.
NAR’s Chief Economist explains
Dr. Lawrence Yun, NAR Chief Economist, says although pending sales decreased in June, the overall trend in recent months supports a solid pace of home sales this summer. “Competition for existing houses on the market remained stiff last month, as low inventories in many markets reduced choices and pushed prices above some buyers’ comfort level.”
“The demand is there for more sales, but the determining factor will be whether or not some of these buyers decide to hold off even longer until supply improves and price growth slows,” added Dr. Yun.
He also notes that existing-home sales are up considerably from last year, despite the share of first-time buyers improving only modestly, giving credit for the boost to pent-up sellers realizing their equity gains from recent years.
“Strong price appreciation and an improving economy is finally giving some homeowners the incentive and financial capability to sell and trade up or down,” adds Yun. “Unfortunately, because nearly all of these sellers are likely buying another home, there isn’t a net increase in inventory. A combination of homebuilders ramping up construction and even more homeowners listing their properties on the market is needed to tame price growth and give all buyers more options.”
Regional performance varied wildly
The PHSI in the Northeast inched 0.4 percent to 94.3 in June, and is now 12.0 percent above a year ago. In the Midwest the index declined 3.0 percent to 108.1 in June, but is still 5.0 percent above June 2014.
Pending home sales in the South also decreased 3.0 percent to an index of 123.5 in June but are still 7.8 percent above last June. The index in the West increased 0.5 percent in June to 104.4, and is now 10.4 percent above a year ago.
The national median existing-home price for all housing types in 2015 is expected to increase around 6.5 percent to $221,900, which would match the record high set in 2006. Total existing-home sales this year are forecast to increase 6.6 percent to around 5.27 million, about 25 percent below the prior peak set in 2005 (7.08 million).
Why this time of year is tough to gauge
According to realtor.com Chief Economist, Dr. Jonathan Smoke, “This is a tricky time of year to assess housing trends as the housing market is very seasonal. The seasonal trend varies by market so a general interpretation of these numbers should be treated with skepticism.”
He adds, “The underlying data was a mixed bag: the Northeast and West had slight increases on the seasonally adjusted index while the South and Midwest experienced declines. Even more confusing is the fact that the non-seasonally adjusted rate actually increased 2.6 percent in June over May, and only the Northeast and West had declines in the nonseasonal index.”
Dr. Smoke concludes by noting, “Regardless of what reading you prefer, the level of sales remains high. You have to go back to 2006 to see better readings on both indices.”
Blog post via The Real Daily
